Spiga

Is This Tutorials Suitable For YOU?

WELCOME to this FREE MS EXCEL learning

This tutorial is suitable for anyone who uses computer in they daily tasks including YOU. It’s written for enormous class of people commonly referred to as users in the computer businesses. With technology evolutions, computer has become a ‘necessary’ in almost every industry. I think it is safe to say that more than 90% of the office jobs in the world today involve computer.

School, college or university students are also highly recommended to take this tutorial. The tutorials here not only can improve your computer knowledge but more importantly it helps you in preparing your paper works, course works, or assignments.

EXCEL AND Function

The Excel AND function returns TRUE if all conditions are TRUE. It returns FALSE if any of the conditions are FALSE.

To determine whether the return will be TRUE or FALSE, the function evaluates at least one mathematical expression located in another cell in the spreadsheet.

The syntax for the AND function is:

=AND (Condition1, Condition2, ...)
condition is something that you want to test that can either be TRUE or FALSE.

Note: In Excel 2007, the AND function can contain a maximum of 255 conditions. For earlier versions of Excel, the limit is 30 conditions.

To use the AND() function (an example)

· Type in the text in Excel A1 and A2 as follow:

· Click on any cell that you wish the result to appears. Type the functions below, the AND function will return the following results:

=AND(A1>10, A1<100)>would return TRUE.
=AND(A1=88, A2="Microsoft") would return FALSE.
=AND(A1>=50, A1<=88, A2="Microsoft Excel") would return TRUE.

To combine the AND function with IF function

· Let’s look at the following example that shows nesting the AND function inside the IF function.

· In the spreadsheet, type-in the following values accordingly:
Cell C1: 75
Cell C2: 95
Cell C3: 85

· Click on the cell C5 and enter the function below.
=IF(AND(B1>80,B2>80,B3>80),"Good","Not Good")

· If all three of these cells (C1,C2 and C3) contains a value greater than 80, the IF function will show the statement Good in cell C5.

· If any of these three cells contain a number less than or equal to 80, the IF function shows the statement Not Good in cell C5.

· So, the result in cell C5 will be Not Good since the cell C1 contains value that is less that 80.


Excel MIN Function


The Excel MIN function is used to find the smallest value in the selected range of cells or a given list of arguments. Text and blank entries are not included in the calculations of the MIN function.

The syntax for the MIN function is:

=MIN (Argument1, Argument2, ... Argument30)
Argument1, Argument2, ... Argument30 can be numbers, named ranges, arrays, or cell references. Up to 30 arguments can be entered in Excel 2003.

To use the MIN function (an example)

· Enter the following data into cells B1 to B5:

· Click on cell B7 where the results will be displayed.

· Type =MIN(B1:B5) in cell B7.

· Once finish, press the Enter key on the keyboard.

· The answer 2177 appears in cell B7 which is the smallest number in the list.

Excel MAX Function


The Excel MAX function is used to find the largest value in the selected range of cells or a given list of arguments. Text and blank entries are not included in the calculations of the MAX function.

The syntax for the MAX function is:

=MAX(Argument1, Argument2, ... Argument30)
Argument1, Argument2, ... Argument30 can be numbers, named ranges, arrays, or cell references. Up to 30 arguments can be entered in Excel 2003.

To use the MAX function (an example)

· Enter the following data into cells C1 to C5:

· Click on cell C7 where the results will be displayed.

· Type =MAX(C1:C5) in cell C7.

· Once finish, press the Enter key on the keyboard.

· The answer 953.5 appears in cell C7 which is the largest number in the list.

Excel COUNT Function


Excel COUNT function will return the number of entries (actually counts each cell that contains number data) in the selected range of cells.

Text and blank entries are not counted. If number data is later added to an empty cell in the range, the count total is automatically updated.

The syntax for the function is:

=COUNT(argument)
Argument is the range of cells to be totaled.

To use the COUNT function (an example)

· Enter the following data into cells B1 to C6:

· Click on cell C7 where the results will be displayed.

· Type =COUNT(B1:C6) in cell C7.

· Once finish, press the Enter key on the keyboard.

· The answer 12 appears in cell C7.

Note: Since dates, times, and formulas are stored as numbers in Excel, the COUNT function will include any cells containing these types of data in the total

Excel AVERAGE function


The Excel AVERAGE function can be used to calculate the average, or arithmetic mean, of values in a selected range of cells.

The syntax of this function is written as follows:

= AVERAGE (argument)
The argument for this function is data contained in the selected range of cells.

To use the AVERAGE function (an example)

· Enter the following data into cells C1 to C6.

· Click on cell C7 where the results will be displayed.

· Type “=AVERAGE( ” in cell C7 (without the quote).

· Click and drag to select cells from C1 to C6 with the mouse.

· Type the closing bracket " ) " after the cell range in cell C7 (without the quote).

· Once finish, press the Enter key on the keyboard.

· The answer 470.83 should be displayed in cell C7.

· The complete function =AVERAGE(C1:C6) appears in the formula bar.

Excel OR Function


The Excel OR function returns TRUE if one condition are TRUE. It returns FALSE if all of the conditions are FALSE.

To determine whether the output will be TRUE or FALSE, the function evaluates at least one mathematical expression located in another cell in the spreadsheet.

The syntax for the OR function is:

=OR (Condition1, Condition2, ...)
condition is something that you want to test that can either be TRUE or FALSE.

To use the OR( ) function (an example)

· Type in the number in cells C1 and C3 as follow:

· Click on cell C5 where the results will be displayed.

· Type =OR(C1>500, C2>500, C3>500) in cell C5

· Once finish, press the Enter key on the keyboard.

· The answer TRUE appears in cell C5.

Note: If any of these three cells (C1,C2, or C3) contains a value greater than 500, the output for the OR function in cell C5 will be TRUE. If all three cells have numbers less than or equal to 500, the output will be FALSE.

The Excel RAND function

The Excel RAND function will generate a random number in Excel that is greater than or equal to 0 and less than 1.

The syntax for the RAND function is:
=RAND( )

To use the RAND( ) function (examples)

· To generate a random number between 0 and 100, use =RAND() *100

· To generate a random number and return only whole numbers use =INT(RAND()*100)

· To generate a random number between 100 and 200, use =RAND() *(200-100)+100

Note: If you want to use RAND function to generate a random number but don't want the numbers to change every time the cell is calculated, you can enter =RAND() in the formula bar, and then press F9 key to change the formula to a random number

Discover the Full Potential of Excel IF Function


The Excel IF Function checks a condition that must be either true or false. If the condition is true, the function returns one value; if the condition is false, the function returns another value.

The function has three arguments: the condition you want to check, the value to return if the condition is true, and the value to return if the condition is false.

Here is the Excel IF()Syntax:
IF(Logical_test, Ation_if_true, Action_if_false)

Logical _test
The logical_test evaluates an expression to see if it passes the test, i.e. is TRUE or does not pass the test, i.e. is FALSE.


Action_if_true
Action_if_true can be a value or an operation. Whichever, the result is placed in the cell that contains the IF ( ) Function if the logical_test is true.

Action_if_false
Action_if_false can be a value or an operation. Whichever, the result is placed in the cell that contains the IF ( ) Function if the logical_test is false.

To demonstrate the Excel IF function

Lets look at an example for calculating a bonuses based on total sales. A company offers its salesman a 5% bonus if the value of the total sales is below $5,000 per month. If the total sales exceed $5,000 per month, the bonus will be 10%.

When translated into the IF ( ) function it looks like the following:
IF(TotalSales>5000,TotalSales * 10%, TotalSales * 5%)

· Enter the following data for column A and column B accordingly.

· Click on the cell to contain the IF( ) function. In this case, cells C2.

· From the Insert menu, click on Function…
OR press the Shift+F3

· From the Insert Function dialog box displayed, select the IF option and then click OK button.

· Enter B2 > 5000 into the Logical_test text area. Press the Tab key.

· Enter 10% into the Value_if_true text area. Press the Tab key.

· Enter 5% into the Value_if_false text area. Click OK.

· Follow the same procedure for the cells C3 to C6.

Note: Every time, you just need to change the data from B2 to B6, then the bonus will be automatically calculated.

Using The Excel Conditional Formatting


Excel conditional formatting allows you to apply different formatting options, such as color, to a cell or cells based on the data in the cell(s).

Here are the 2 easy steps to implement the conditional formatting:
1. Create a set of conditions that control formatting changes in the target cells.
2. Enter your data. If the conditions you set are met by the data, then the formatting is applied.
Note: Up to three conditions can be set for a cell, so it is possible to vary the formatting as the contents of a cell changes.

To format cells using conditional formatting

· Select the range of cells which you wish to apply conditional formatting. In this example the range would be A1:C5.

· From the Format menu, click Conditional Formatting.

· Lets say we wish to highlight all values between 4 and 6, then we would enter the numbers in the correct fields, as illustrated above.

· If we click on the OK button, then no special formatting would be applied to these values, so next we need to click on the Format button within this dialog box.

· From the normal Format Cells dialog box is displayed, from which we can specify how data that meets the specified criteria will be displayed.

· Select a color for the conditional formatting; choose red, for this example.

· When finished click on the OK button to close this dialog box, which will return to the Conditional Formatting dialog box.

· To add the other conditional formats, click the Add button. Otherwise, click on OK button to close this dialog box.

Excel Worksheet and Workbook Protection

Excel worksheet and workbook protection feature allows you to protect your file being open by unauthorised person. You can set the password so that anyone that intend to open the file required the password to open it.

To specify a password for opening and modifying a workbook

· From the File menu, click Save As.

· From the Save As dialog box displayed, click on the Tools icon and from the drop down list displayed, select General Options.· From the Save Options dialog box displayed, enter a password into the Password to open: text box. In future you will be required to enter this password in order to open the file

· If you enter a password into the Password to modify: text box, this gives others the ability to open, view and edit a workbook, but not to save it with the same name. They must save a modified version of the workbook with a different name.

· Click Yes.

· The file is reopen but with the feature ‘read-only’.

· If you needed to make changes on the worksheet, you cannot save the file with the same file name. So, changing the file name allows you to save the file.

To remove a password from a workbook

· Open the workbook containing the password you wish to remove (by entering the password when prompted).

· From the File menu, click Save As.

· From the Save As dialog box displayed, click on the Tools icon, and from the drop down list displayed select General Options.

· From the Save Options dialog box displayed, clear either or both passwords text box.

· Click on the OK button to close the Save Options dialog box.

· Click on the Save button to save the file, which will display a dialog box.

· Click on the Yes button.

To protect a workbook

· From the Tools menu, point to Protection and click on Protect Workbook.

· This will display the Protect Workbook dialog box.

· From the Protect Workbook dialog box displayed, you have two options:

Structure

Prevents any changes to the structure of the workbook if checked. i.e. you will be unable to edit, insert, delete, rename, copy, move or hide sheets.

Windows

Prevents changes to the workbooks size. The windows re-sizing controls (close, maximize, minimize and restore) are hidden.

· In the Password column, you can enter a password (case sensitive). Click OK.

· You will be asked to re-type the password to ensure that it is consistent.

· Click OK.

To unprotect a workbook

· From the Tools menu, point to Protection and click on Unprotect Workbook.

· Enter the required password and click on OK.

To protect a worksheet

· From the Tools menu, point to Protection and click on Protect Sheet.

· This will displays the Protect Sheet dialog box.

· Click on the OK button. You will be asked to re-type the password to ensure that it is consistent.
Note:
(1) The check box "Always create backup" forces Excel to create a backup copy of the file every time a worksheet file is saved. The file extension BAK is used, and the backup file is saved in the same folder as the original file.

(2) If the "Read-only recommended" check box is ticked, the following dialog box is displayed when the file is re-opened

· From the Protect Sheet dialog box displayed, you can choose any option from the lists if you ALLOW other users to modify the checked option in the worksheet.

· In the Password to unprotect sheet: column, you can enter a password (case sensitive). Click OK.

· You will be asked to re-type the password to ensure that it is consistent.

· Click OK.

To unprotect a worksheet

· From the Tools menu, point to Protection and click on Unprotect Worksheet.

· Enter the required password and click on OK.

Excel Macro – Make Your Complex Tasks Automated


Excel Macro – Make Your Complex Tasks AUTOMATED

The Excel Macro…What is that?

· A macro is a series of commands and functions that can be run whenever you need to perform the task.

· Macros can automate complex tasks and reduce the number of steps required to complete tasks that you perform frequently.

· The easiest way to create an Excel macro is to have Excel records the actions and then store these actions as a macro.

· Macros can be played back or modified at any time.

To record a macro

· From the Tools menu, point to Macro and click on Record New Macro.

· From the Record Macro dialog box displayed, enter a name for the macro in the Macro name: text box.

· The default description is displayed in the Description: text box, and contains the date and user name. If required, change it.

· To begin recording, click OK.

· Perform the actions you want the macro to record. Actions can be any combinations of Excel commands.

· To stop recording, from the Tools menu, point to Macro and click on Stop Recording.

To assign a shortcut key to the macro

· From the Tools menu, point to Macro and click on Macros.

· From the Macro dialog box displayed, select the macro name (if recorded before) to which you want to assign a shortcut key.

· Click the Options button to display the Macro Options dialog box.

· Type a letter into the Ctrl+ text box. This combination key will be used to invoke the macro.

· Click OK to return to the Macro dialog box.

· Click on the Cancel button to close.

To run a macro using the Tools Macro command

· From the Tools menu, point to Macro and click on Macros.

· From the Macro dialog box displayed, click on the name of the macro you wish to run in the Macro name: list box.

· Click the Run button.Note: If you wish to edit or delete a macro, just click on the particular button.

To run a macro using the assigned shortcut key

· Press Ctrl+?, with ? is the letter which you assigned.

To create a button and assign an Excel macro to it

· If the Forms toolbar is not display, right click on any toolbar that is visible and from the pop-up menu that is displayed select Forms.

· To create a button, click the Button icon on the Forms toolbar.

· Then, click and drag the mouse to the intended button size.

· When release the mouse button, the Assign Macro dialog box will be displayed.

· Click on the Record button and the Record Macro dialog box will be displayed.

· Enter a name for the macro in the Macro name: text box.

· Click on the OK button.

· Record your macro in the normal way, and click on the button and select Edit Text from the pop-up menu.

· To run the macro, simply click on the button.

To change a button name

· Double click on the button to highlight the button name.

· Type in a new name and click on any worksheet cell to deselect the button.

To delete a button

· Click on button and press the Delete key.


Step 4: The Excel Chart Wizard (4) – Chart Location


To define the chart location

· You can choose to place the chart on an existing worksheet as an object, or you can place it on a new worksheet. Two options for you to choose:
As new sheet: – It will place the chart in the new worksheet.
As object in: - It will place the chart in the existing worksheet.

· Click on the Finish button and the chart will be created as you have specified during the Chart Wizard creation process.

Step 3: The Excel Chart Wizard (3) – Chart Options


From the chart options dialog box displayed, you can select Titles, Axes, Gridlines, Legend, Data Labels and Data Table tabs and make the necessary changes.

To add title to a chart

· In the Chart title: text box, enter the name for the chart, i.e. Exam results.

· In the Category (X) axis: text box, enter a title for the X axis, i.e. Subject.

· In the Category (Y) axis: text box, enter a title for the Y axis, i.e. Mark score.

· In the example used, the screen will be as illustrated.

To customize the chart axis

· From the Chart Option dialog box displayed, click on the Axes tab.

· It allows you to control the way the axes are displayed, you can tick or un-tick the check box to see the effects on the chart.

To customize chart gridlines

· From the Chart Option dialog box displayed, click on the Gridlines tab.

· You can choose to display the major and minor X and Y gridlines for the axis by clicking on the particular check box.

To customize chart legend

· From the Chart Option dialog box displayed, click on the Legend tab.

· You can choose to display or not the chart legend and the placement of the legend in the chart by clicking on the radio button.

To customize data labels

· From the Chart Option dialog box displayed, click on the Data Labels tab.

· You can choose to display or not the chart data labels by clicking on the radio button.

To display a data table

· From the Chart Option dialog box displayed, click on the Data Table tab.

· You can choose to display or not the chart data table by ticking on the check box.

· Click on the Next button to continue and this will display the final page of the Chart Wizard – Chart Location.

Step 2: The Excel Chart Wizard (2) – Data Source

· The Data Range tab allows you to specify the exact data that you wish to display within your chart.

· You can choose to display Series in Rows or Columns. In the case of the example data used, the two effects will be as illustrated. Choose the Series in Rows.

· When you click on the Next button, this will display the Chart Options dialog box.

The 4 Easy Steps to create an Excel Chart


Here is the step-by-step guides to create an outstanding Excel chart.

Step 1: The Chart Wizard (1) – Chart Type

· Click on any cell within the data containing the information that you wish to display as a chart, or highlight the exact data that you wish to display as a chart.

· Click the Chart Wizard icon on the Standard toolbar. This will display the Excel Chart Wizard as show below:

· From the Chart type: section you can select the type of chart that you wish to create.

· Then from the Chart sub-type: section you can select the exact format that you required for the selected chart type.

· To see how the selected chart will look, use the Press and Hold to View Sample button within the dialog box. In our example, we accept the default selection.

· Click the Next button to see the next page of the dialog box - Chart Source Data.

Excel Function


Functions are special commands used in formulas to perform mathematical processes.

To enter functions directly into the worksheet cell

· Select the cell into which the formula will be entered.

· Insert an equal (=) sign to begin the formula. The formula toolbar buttons will appear.

· Enter the name of the function [e.g. SUM], followed by an opening parenthesis [(], any arguments required for the function [e.g. E2:E5], and closing parenthesis[)].

· Press Enter. If there are no errors in the formula, the result of the function will be entered in the cell. If you activate the cell again, the function will be displayed in the formula bar.

To use the AutoSum function

· The functions can be accessed through the AutoSum icon on the Standard toolbar.

· The functions included in the AutoSum drop-down menu will insert the function and predict the arguments.

· For example, if the active cell is positioned at the bottom of the list of values, AutoSum will display a sum function with the list of the arguments.

· Sum -- add the contents of the list of arguments.

· Average -- determine the average value of the list of arguments.

· Count -- count the number of values in the list of arguments.

· Max -- return the maximum number in the list of arguments.

· Min -- return the minimum number in the list of arguments


Example: Using the Average function

· Enter the values as shown below from B1 to B5 and select the cell B6 which the formula will be entered.

· Click the down arrow beside the AutoSum icon on the Standard toolbar and choose Average from the drop-down menu.

· If the predicted range is correct, press the Enter key. If it is incorrect, select (click and drag) the range you want with the mouse and press the Enter key.

· The result will show in cell B6. You can use the same method to do other functions such as SUM, Max, etc.

Note: Excel formula and function is one of the most powerful feature in Microsoft Excel. It is important for you to master it.

Excel Formula

A formula is an equation that performs operations on worksheet data. Excel formula can perform mathematical operations, such as addition and multiplication, or they can compare worksheet values or join text.

To enter a formula

· Place the cursor in the cell where the formula will appear.

· Enter an = sign.

· Enter the expression that will produce the result you want, e.g. A5+E5. This will add the value in A5 with the value in E5.

· When the formula is complete, press Enter. The result of the formula will be calculated and displayed in the cell.

· If there is an error in an Excel formula, an error message which begin with a # sign will display.

To enter a cell or range reference by pointing

· Place the cursor in the cell where the formula will appear.

· Enter the formula up to the point of the cell or range reference, e.g. to enter the formula =E2+E5, only enter the = sign.

· Using the arrow keys, move the cell pointer to the first cell reference, in this case E2. The formula will track your progress and enter the current address into the formula.

· Enter the operand, + sign.

· Using the arrow keys, move the cell pointer to the second cell reference, in this case E5. If you are calculating a range of cells, hold down the Shift key while using the arrow keys to move to the intended cells.

· Press Enter to complete the formula when you have reached the cell you require.

The Excel Formatting - Numbers


To change number formatting using the formatting icons

· You can quickly change the formatting of a cell or selected range by using the following icons on the Formatting toolbar.

Currency

12345 will become $12,345.00

Percent

.25 will become 25%

Comma

98765 will become 98,765.00

Increase Decimal

12,345.00 will become 12,345.000

Decrease Decimal

98,765.00 will become 98,765.0

To format a number as a currency

· Select the cell or range of cells you want to format.

· From the Format menu, click Cells.

· From the Format Cells dialog box displayed, select the Number tab.

· In the Category: section, select Currency.

· Select the number of decimal places you require by using the Decimal places: spin box arrows.

· In the Symbol: section drop down list, select the type of currency.

· Click OK.

To format a number as a percentage

· Select the cell or range of cells you wish to format.

· From the Format menu, click Cells.

· From the Format Cells dialog box displayed, select the Number tab.

· In the Category: section, select Percentage.

· Select the number of decimal places you require by using the Decimal places: spin box arrows.

· Click OK.

The Excel Formatting - Colors

To change the color of text

· Select the cells containing the data you want to change the color.

· On the Excel Formatting toolbar, click the down arrow next to the Font Color icon.

· Choose a color from the Font Color palette.

· The color you selected from the Font Color palette will be displayed on the new icon face. Click on the icon face to apply the new color to the cell.

To apply colors to cell(s)

· Select the cell or range of cells you wish to color.

· On the Excel Formatting toolbar, click the down arrow next to the Fill Color icon.

· Choose a color from the Fill Color palette.

To turn off the cell(s) color

· Select the cell or range of cells you wish to color.

· On the Excel Formatting toolbar, click the down arrow next to the Fill Color icon.

· Choose No fill.

The Excel Formatting - Alignment

To align data between the left and right sides of a cell

· Select the cell, or cells, you wish to align.

· On the Excel Formatting toolbar, click on the Align Left icon to align data with the left edge of the cell.

· Click on the Align Right icon to align data with the right edge of the cell.

· Click on the Center icon to center data in the cell.

To align data between the top and bottom of a cell

· Select the cell, or cells, you wish to align.

· From the Format menu, click Cells.

· From the Format Cells dialog box displayed, click on the Alignment tab.

· In the Text alignment section, choose the Top, Center, or Bottom option in the Vertical area to align the data in the cell.

· To make the lines of data fit evenly within the height of a cell, tick the Justify distributed option and click on OK.

To change the orientation of data cells

· Select the cell, or cells, you wish to change.

· From the Format menu, click Cells.

· From the Format Cells dialog box displayed, click on the Alignment tab.

· In the Orientation section, you can change the Degrees of the text or use the mouse to drag the 'red small diamond' up or down. When satisfied, click on OK.

To wrap multiple lines of data in a cell

· Type the data you require into the cell and press Enter. The entry will appear as one long line and select the cell, or cells, you wish to format.

· From the Format menu, click Cells.

· From the Format Cells dialog box displayed, click on the Alignment tab.

· In the Text control section, tick the Wrap text check box and click on OK.

To shrink the text into one cell

· Type the data you require into the cell and press Enter.

· From the Format menu, click Cells.

· From the Format Cells dialog box displayed, click on the Alignment tab.

· In the Text control section, tick the Shrink to fit check box and click on OK.

To merge several cells

· Select the cells that you wish to merge to become one cell.

· Right-click on the selected cells, click Format Cells.

· From the Format Cells dialog box displayed, click on the Alignment tab.

· In the Text control section, tick the Merge cells check box and click on OK.
Note: You also can use the Merge and Center icon on the Excel Formatting toolbar

The Excel Formatting - Fonts

To change the font used in a cell or range of cells

· Select the cell or range of cells you wish to change.

· On the Excel Formatting toolbar choose a font from the Font drop down list.

To change other font characteristics

· Select the cell or range you wish to change.

· From the Format menu, click Cells.

· From the Format Cells dialog box displayed, select the Font tab to change the Font, font style, or size.

· Select the Underline: drop down list box to select a style of underline or None to remove the underlining.

· Select the Color: drop down list box to choose a font color.

· In the Effects section, you can tick Strikethrough, Superscript, or Subscript.

· To change all the settings in the dialog box back to the Normal style which is set in the Style dialog box, tick the Normal font check box.

· Select OK to close the Format Cells dialog box.

The Excel Formatting Toolbar


Excel formatting toolbar normally located near to the top of your screen as shown here. The toolbar icons have a specific purpose that can change the outlook of your spreadsheet when you apply formatting to it.

The formatting toolbar icons and functions:

· Font – to select fonts from a drop-down list.

· Font – to select fonts from a drop-down list.

· Font Size – to select a font size from a drop-down list.

· Bold – to apply bold to a selected range.

· Italic – to apply italic to a selected range.

· Underline – to underline a selected range.

· Align Left – to align a selected range to the left.

· Center – to center a selected range

· Align Right – to align a selected range to the right.

· Merge and Center – to merge cells and center text across a selected range.

· Currency Style – to apply currency style to a selected range.

· Percent Style – to apply percentage style to a selected range.

· Comma Style – to apply comma style to a selected range.

· Increase Decimal – to decrease the number of decimal points displayed in a selected range.

· Decrease Decimal – to increase the number of decimal points displayed in a selected range.

· Decrease Indent – to decrease the level of indentation in a selected range.

· Increase Indent – to increase the level of indentation in a selected range.

· Borders – to select and apply borders to a selected range.

· Fill Color – to select and apply color to a selected range.

· Font Color – to select and apply color to text in a selected range.

Creating and Opening Workbooks


· Click on the New icon located on the Standard toolbar
OR press Ctrl+N

To open a file

· From the File menu, click Open.

· From the Open dialog box as displayed, use the Look in: drop down menu to select the drive or folder that contains the file you want.

· To open the file you can either double-click on the file name
OR select the file name by clicking on it, and then click on the Open button.

Microsoft Excel - Data Entry Techniques
Here is the guide that shows the easy ways that you can use to enter data into the worksheet.

To fill a range of cells with the same data

· Highlight the cells you wish to fill.

· Enter the information that you wish to fill the selected range with.

· Press Ctrl+Shift+Enter and the range will be filled.

To fill a range of cells with the 'automatic' data

· Highlight the cells you wish to fill.

· Enter the data into the cells as follow: A1: 1; A2: 2

· Use the mouse to drag from cell A1 to A2.

· Place your mouse in the bottom right corner of the selected cells until you see the “+”

· Click and drag the mouse down the cells as you wish. You will see the selected range will fill with continuous numbers 3, 4, 5, 6,…
Note: You also can replace the above A1 and A2 cells with days of week such as Monday, Tuesday,... and months like January, February,...

Microsoft Excel - Navigating in the Worksheet


How you can move from one place to another in Microsoft Excel? Here is the ways:

To move to a particular cell (quick way)

· Enter the cell that you wish to jump to into the Name Box (at the top, left of the screen). In the example shown the cell reference J50 has been entered. When you press the Enter key you will jump to the cell you entered

To move from cell to cell using the keyboard

· To move from cell to cell, use one of the following key or combination keys:

Icon

Function

One cell to the right.

One cell to the left.

One cell down.

One cell up.

Ctrl + →

To the right-hand edge of the current region.

Ctrl + ←

To the left-hand edge of the current region.

Ctrl + ↓

To the bottom edge of the current region.

Ctrl + ↑

To the top edge of the current region.

Home

To the first cell in the row.

Ctrl + Home

To the first cell in the worksheet.

Ctrl + End

To the lowest right-hand cell in the worksheet that contains a data entry.

Page Down

One screen down.

Page Up

One screen up.

Alt + Page Down

One screen to the right.

Alt + Page Up

One screen to the left.

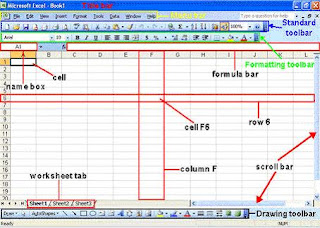
The Microsoft Office Excel 2003 screen elements


By default, Microsoft Excel workbook contains 3 blank worksheets, which are identified by tabs displaying along the bottom of the screen.